Customer Churn Prediction - XAI

Introduction
This post is about using machine learning to predict customer churn in the telecommunications sector. A customer is said to have "churned" when they leave they leave their telecommunications (telco) provider. Predicting when a customer will churn is vital for a telco provider looking to devise strategies to not just capture but retain customers as they exist in a highly competetive marketplace and free services make it easier for the customer to switch provider than ever before. It is said that "the cost of retaining existing customers is 5–10 times lower than the cost of obtaining new customers" (reference) so a strong customer churn prediction (CCP) strategy is inextricably linked with maximising profits and providing customer satisfaction.
With this in mind this post will discuss three CCP models, utilising the IBM dataset, and attempt to predict not just which customers will churn but also give an idea as to why these customers are churning using the Explainable AI (XAI) technique of partial dependence.
This blog post is a high level overview of my coursework for the Explainable AI module from my Master's degree, the full paper can be viewed here. The coursework achieved a mark of 90% and I was invited by my lecturer to present it at an international IEEE conference. I would encourage you to read the original paper, it's some of my best work from my degree! 🧑🎓
Dataset
The dataset used for this investigation of CCP is the IBM dataset, available here. This is based on a fictional telco company. It contains 7043 rows of data and 21 features, 2 of which will be dropped as one is an id and the other (total charges) is highly correlated with the tenure and the monthly charges features.
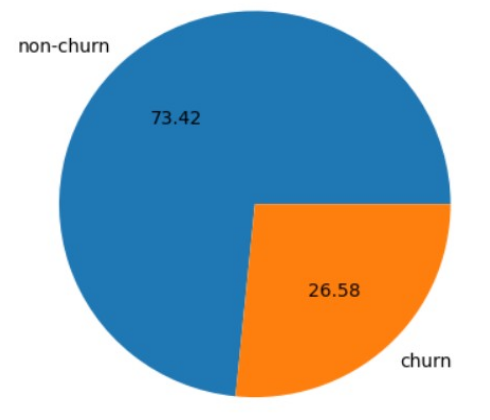
The dataset is highly imbalanced; As the following figure shows only 27% of clients are churners. For this reason the oversampling method SMOTE was used to address this balance. Synthetic samples are created to bulk up the minority class to 50% of all data.
After oversampling the data was split using the holdout method with an 80/20 split and the target feature was set as "churn".
Models
3 models were used, these models were chosen based on the findings of the literature review. These models are extreme gradient boosting, ADABoost and random forest. Extreme Gradient Boosting is a classifier that assembles a collection of decision tree algorithms with gradient boosting. Random forest is also an assembly of decision trees whereby each tree votes on the final classification of the target feature. ADABoost calls a base learning algorithm repeatedly in a series of rounds, this “weak” algorithm (in scikit learn this is a decision tree) is boosted in an iterative fashion by attempting to increase the weight of examples misclassified and decrease the weight of correctly classified examples.
Hyper-parameter tuning was performed using the random search method. This can be expected to return the optimal hyper-parameters for each classifier in a more performant manner than a grid search.
XAI
All three of these models can be considered to be "black box models". This is where explainable AI techniques come into play. With a standard decision tree important features (i.e. features that carry greater weight in the final prediction of churn/non-churn) can be inferred from their position relative to the top of the tree, this makes it inherently explainable, especially with simpler trees. However the complexity of the assemblage of decision trees that is present in each of the above models prohibits such easy explanations. Therefore an XAI technique is required, in this case I used partial dependence.
The partial dependence formula is as follows:-

Partial dependence plots (PDPs) work by marginalizing the model output over the distribution of the features in set C, so that the function shows the relationship between the features in set S we are interested in and the predicted outcome. In other words the feature of interest is set as a range of values while the other features are held constant and the effect of the feature on the target feature (churn) is plotted.
Data Analysis
First the 3 classifiers were fit to the data. The results were as follows:-
| Classifier | Accuracy | ROC AUC |
|---|---|---|
| XGBoost | 0.78 | 0.75 |
| ADABoost | 0.72 | 0.79 |
| Random Forest | 0.79 | 0.73 |
So churn can be predicted with a decent degree of accuracy. The accuracies above are not the highest however this is expected as the literature review uncovered few papers achieving over 0.80 accuracy on the IBM dataset.
The ROC AUC (receiver operating characteristic area under curve) is a plot of the true positive rate against the false positive rate. It is used for binary classification tasks and the area under the curve gives an indication of how well the classifier has performed. For the sake of brevity this blog post will only go into detail about the partial dependence analysis performed for the best performing classifier in terms of ROC AUC (this was the ADABoost classifier).
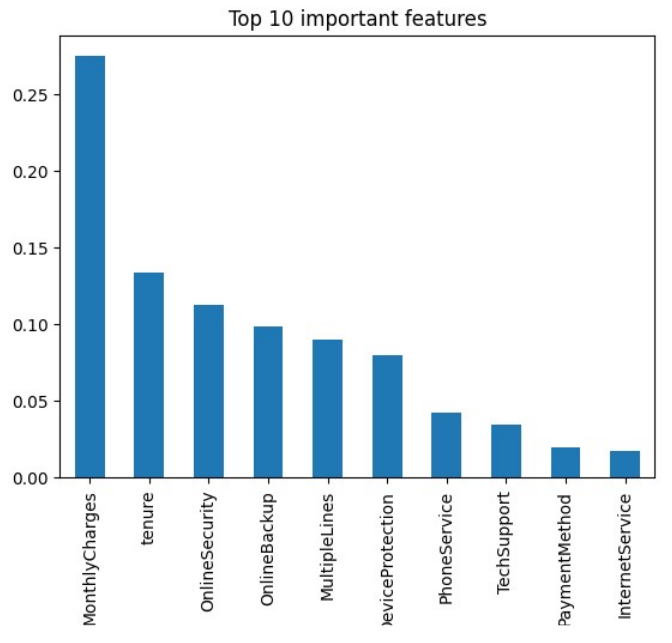
In order to delineate the features for which partial dependence plots will be obtained I used scikit-learns inbuilt feature_importances method then plotted PDPs for the top 3 features. These were monthly charges, tenure and online security.
PDP Analysis
Partial dependence plots are easy to implement with scikit-learn.
pdp = PartialDependenceDisplay.from_estimator(
        clf,
        X,
        features=['MonthlyCharges'],
        grid_resolution=10
    )
plt.xlabel('Monthly Charges ($)')
plt.setp(pdp.deciles_vlines_, visible=False)
The PDP analysis for monthly charges is as follows:-
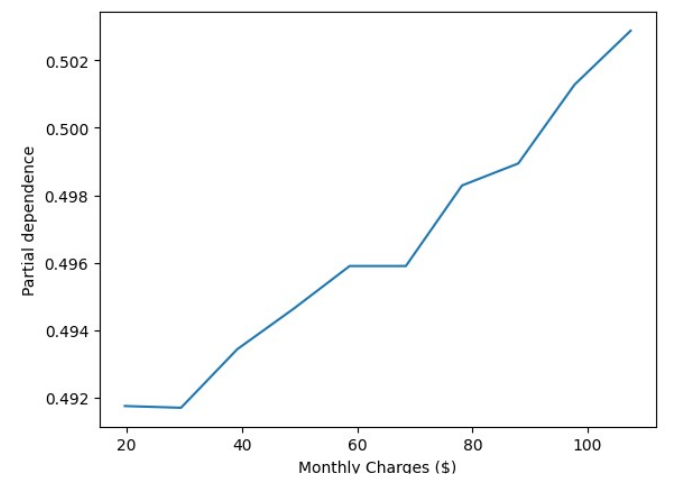
This shows partial dependence increasing as monthly charges increases. Meaning a customer is more likely to churn and leave their telco service provider as their monthly charges increases. This is an expected result as customers are always on the lookout for better deals. The advice to the telco company would be to revise their pricing structure where possible in order to avoid losing their customers and to maintain competitiveness in the marketplace.
The PDP analysis for the next most important feature (tenure) is as follows:-
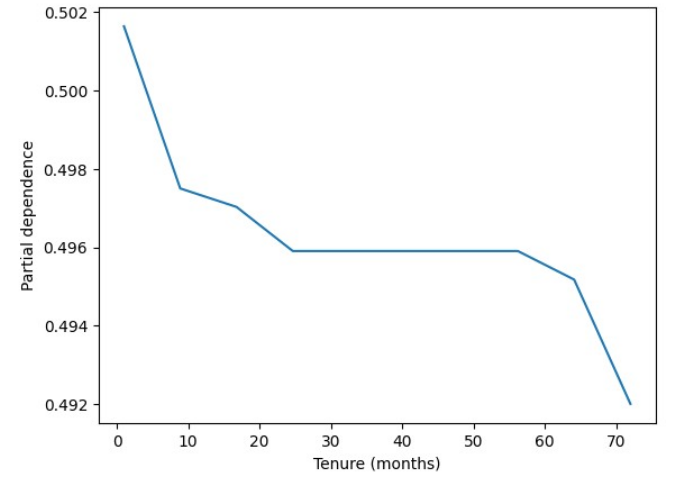
This shows a level of customer loyalty because as the tenure increases partial dependence decreases. The advice to the company would be to provide special rewards and offers to customers who have a shorter tenure with them in order to keep their services.
The PDP analysis for the third most important feature (online security) is as follows:-
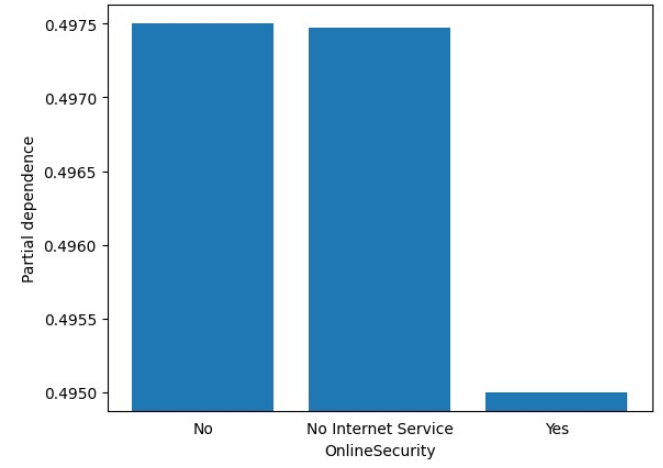
This is a bar chart because the feature is categorical. Its shows that customers with no internet service or no online security are far more likely to churn than customers with an online security package. The advice to the company would be to try and upsell their online security packages to those that don’t have it then they feel safer when using the companies services.
Conclusion
This was just a brief run down of some of my explorations into explainable AI. I believe that two things have been achieved here. Firstly CCP has been performed with a reasonable degree of accuracy, the achievable accuracy is likely to be limited for this particular dataset. Secondly the partial dependence analysis backs up the predictions with tangible reasons as to why these customers might be churning. In my opinion this is a good example of the value of explainable AI and fosters trust in the model, which is very important when it's predictions are used as the foundation for important business decisions.
More on explainable AI will follow in this blog in the future, possibly including exploration of SHAP which I used for my dissertation to explain the Music Genre Recognition model.